Board reviews 2025 exam results, members ask for national comparisons and finer structural exam reporting
March 06, 2026 | Respiratory Care Board of California, Boards and Commissions, Executive, California
This article was created by AI summarizing key points discussed. AI makes mistakes, so for full details and context, please refer to the video of the full meeting. Please report any errors so we can fix them. Report an error »
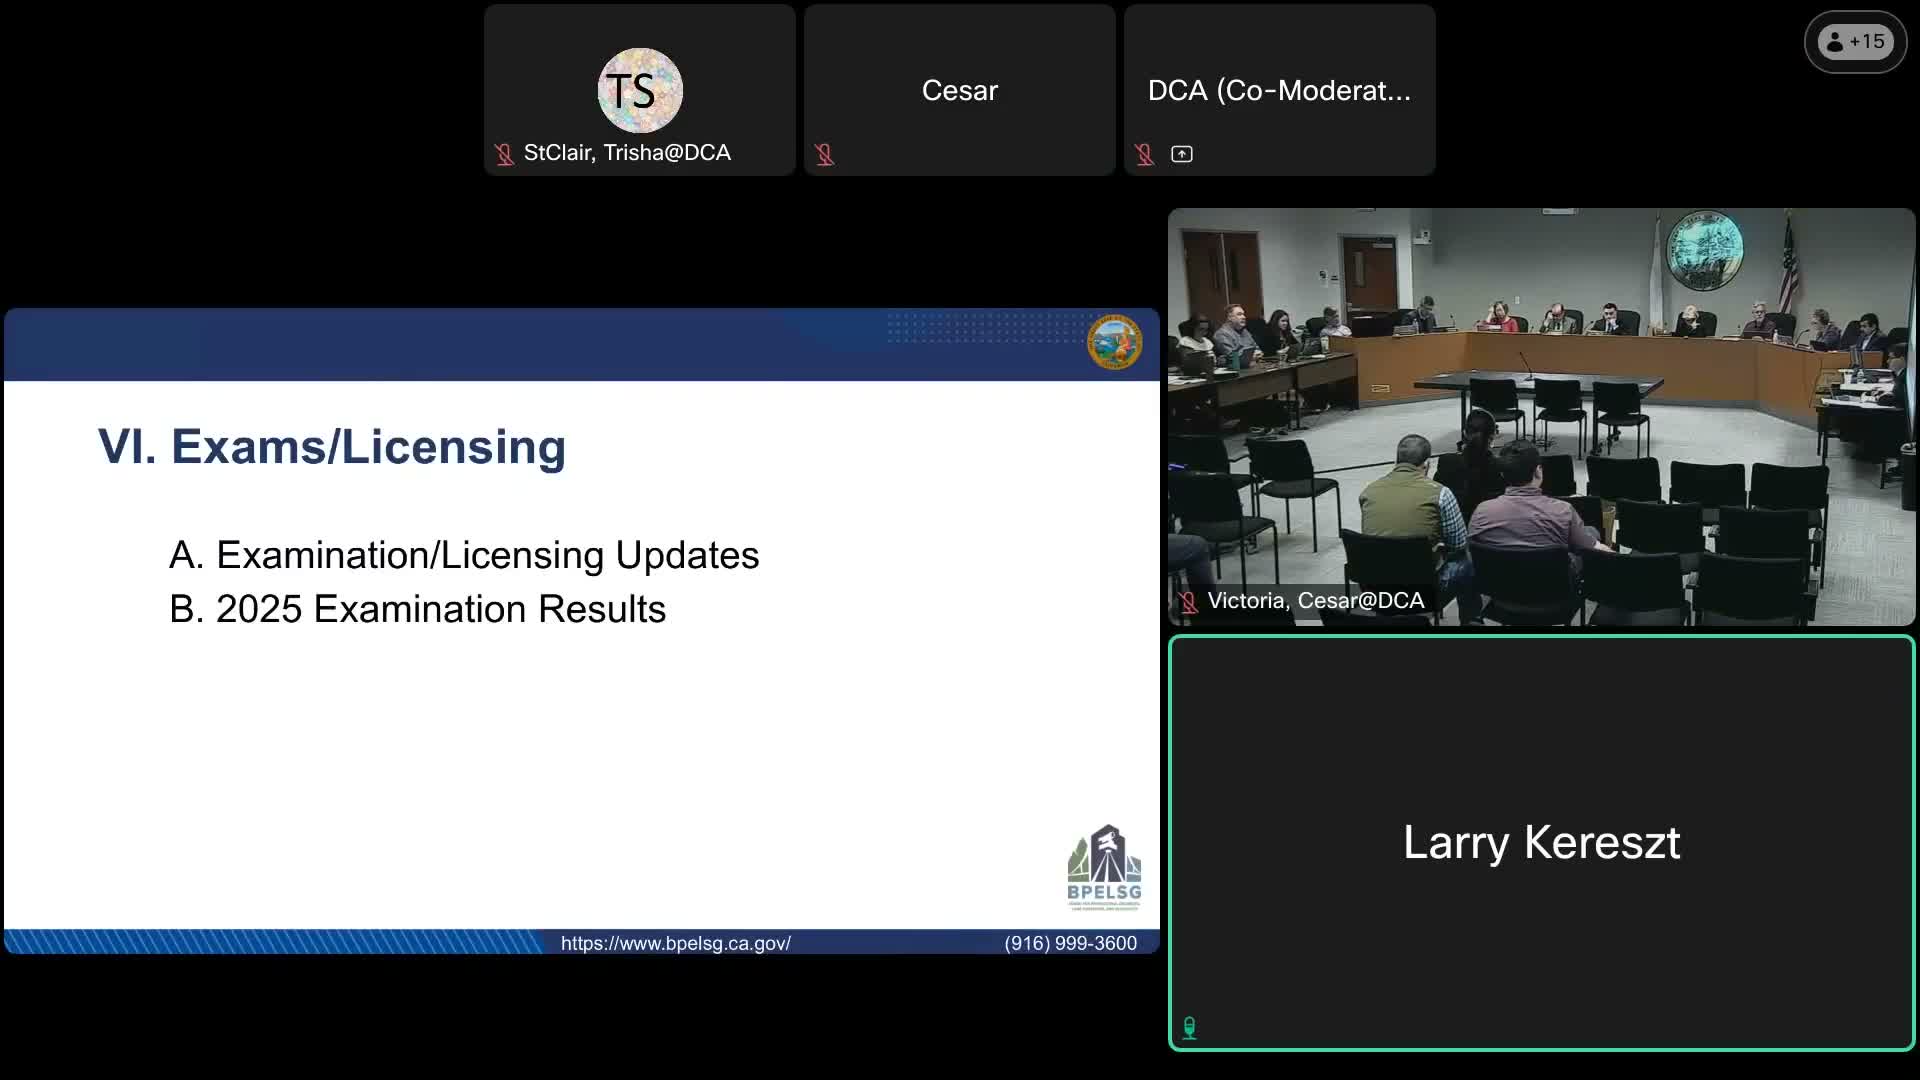
Larry Kerest, manager of examination development, briefed the board on 2025 examination results and historical data going back to 2018. He reported that six of nine state exams had their highest totals since 2018 and explained that some exams (for example, fire protection) are offered only in the spring, creating zeros in quarterly tables that reflect administration cadence rather than absence of candidates.
Board members asked for clearer visuals and comparative data. "At a glance, the various trends in pass rates — particularly pass rates — I would love to see line graphs next," one member said. Members also asked staff to include national passing-rate comparisons and to report the structural exam as separate breadth and depth statistics, rather than a combined vertical/lateral presentation, to make national comparisons more transparent.
A public commenter representing the Structural Engineer Association asked the board to show results for all four structural exam parts (breadth and depth) because combined pass rates can be misleading across differing exam formats.
Next steps: staff agreed to add line charts and to explore adding national-pass-rate comparisons and better disaggregation of structural exam components in future reports.
Don't Miss a Word: See the Full Meeting!
Go beyond summaries. Unlock every video, transcript, and key insight with a Founder Membership.
✓
Get instant access to full meeting videos
✓
Search and clip any phrase from complete transcripts
✓
Receive AI-powered summaries & custom alerts
✓
Enjoy lifetime, unrestricted access to government data
30-day money-back guarantee
