UNM’s forensic imaging center demos how to access and measure postmortem CT images from NMDID
February 02, 2026 | Office of Justice Programs, Department of Justice (DOJ), Executive, Federal
This article was created by AI summarizing key points discussed. AI makes mistakes, so for full details and context, please refer to the video of the full meeting. Please report any errors so we can fix them. Report an error »
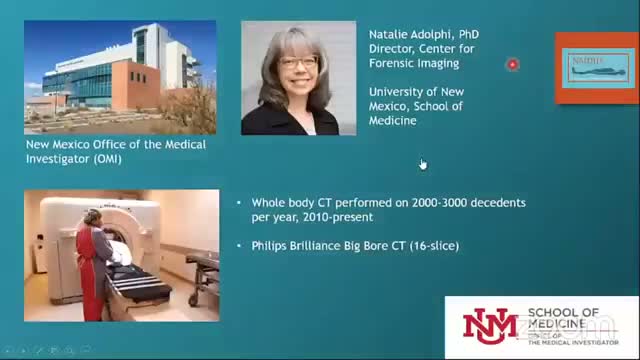
Dr. Natalie Adolphie, director of the Center for Forensic Imaging at the University of New Mexico School of Medicine, demonstrated how approved users can access, download and view postmortem CT datasets from the New Mexico Decedent Image Database (NMDID).
Adolphie said the center performs “approximately 2,000 to 3,000 decedents per year” since 2010 and that the image data form the NMDID. She identified the acquisition scanner as a Philips Brilliant Big Bore 16‑slice CT unit and acknowledged grant support from the National Institute of Justice, adding that the findings presented reflect the authors’ views, not necessarily the NIJ’s.
During the demonstration Adolphie walked attendees through the user workflow: approved users receive an email from nmdidunm.edu titled “Images Approval,” log into the NMDID site, open their cart and download authorized cases. Each case downloads as a single zip folder that must be extracted; she showed an example case that was about 5.5 gigabytes and contained 11,316 files, and said extraction on her machine required about 45 minutes. "Figure on at least half an hour per case," she advised, noting actual time depends on internet speed.
After extraction, each case folder contains two top‑level directories: JPEG localizers (scout images that indicate the anatomic region) and the DICOM image data. Adolphie explained that each DICOM subfolder represents an image series (a stack of 2‑D slices covering a region), and showed an example series containing 198 images. Series naming conventions include tags such as "head and neck," "UX" for upper extremities and algorithm indicators like "bone" or "ST" for soft‑tissue reconstructions.
She described differences important for analysis: "thin" series are reconstructed at 1‑millimeter slice thickness with 0.5‑mm spacing (best for 3‑D models and multiplanar reconstructions), while "3 by threes" are 3‑mm slices and faster to browse but lower resolution for reconstructions; sagittal and coronal reformats are typically 3 mm.
Adolphie also explained image units and viewing basics: CT volumes are three‑dimensional arrays of voxels, with CT numbers expressed in Hounsfield units (HU). She noted the scale runs from about −1,000 (air) to roughly +3,000, with 0 calibrated to water. She demonstrated how reconstruction algorithms (bone vs. soft tissue) change image sharpness and noise, and emphasized that viewer window width and level change display contrast but do not alter the underlying reconstruction.
For viewing and measurement she demonstrated the RadiAnt DICOM viewer. She recommended opening a DICOM folder (the study) to see available series thumbnails, then selecting an appropriate series to scroll through slices. She showed how to display DICOM header tags (scanner model, reconstruction algorithm, slice thickness, voltage and other acquisition metadata) and how to pan, zoom and change window presets (soft tissue, bone, abdomen).
Using RadiAnt's tools, Adolphie demonstrated three measurements: a linear length between the basion and dens (used when evaluating atlanto‑occipital dislocation), which returned a measurement of 5.56 millimeters in her example; an elliptical region‑of‑interest (ROI) drawn on liver and spleen that returns statistics (area, pixel count, mean, standard deviation, min and max); and an angle tool measuring lumbar lordosis (example result 52.2 degrees). She cautioned that ROI placement matters for assessments such as hepatic steatosis and that thin slices are best for accurate 3‑D work.
In the Q&A, Adolphie confirmed that protocol details are available on the NMDID site and that per‑image parameters can be inspected via DICOM tags. When asked about ROI units she stated, "the mean, standard deviation, min, and max are all in Hounsfield units," giving example liver values in the 30–40 HU range. She also clarified that downloads come as a single case folder (you cannot download only the head series from the server), but once the case is extracted, a viewer can open only the head series if the user wishes. On whether bone versus soft‑tissue reconstructions produce measurable shifts, she said she did not have a definitive answer but estimated differences would be on the order of a pixel and recommended a formal study to quantify algorithm effects on anthropometric measurements.
The webinar concluded with thanks to Dr. Adolphie and organizers; she noted a subsequent webinar will demonstrate 3‑D Slicer for more advanced 3‑D operations.
View the Full Meeting & All Its Details
This article offers just a summary. Unlock complete video, transcripts, and insights as a Founder Member.
✓
Watch full, unedited meeting videos
✓
Search every word spoken in unlimited transcripts
✓
AI summaries & real-time alerts (all government levels)
✓
Permanent access to expanding government content
30-day money-back guarantee
