Health department narrows surveillance dashboard as seasonal diseases wane
April 03, 2023 | Summit County Health Department, Summit County Commission and Boards, Summit County, Utah
This article was created by AI summarizing key points discussed. AI makes mistakes, so for full details and context, please refer to the video of the full meeting. Please report any errors so we can fix them. Report an error »
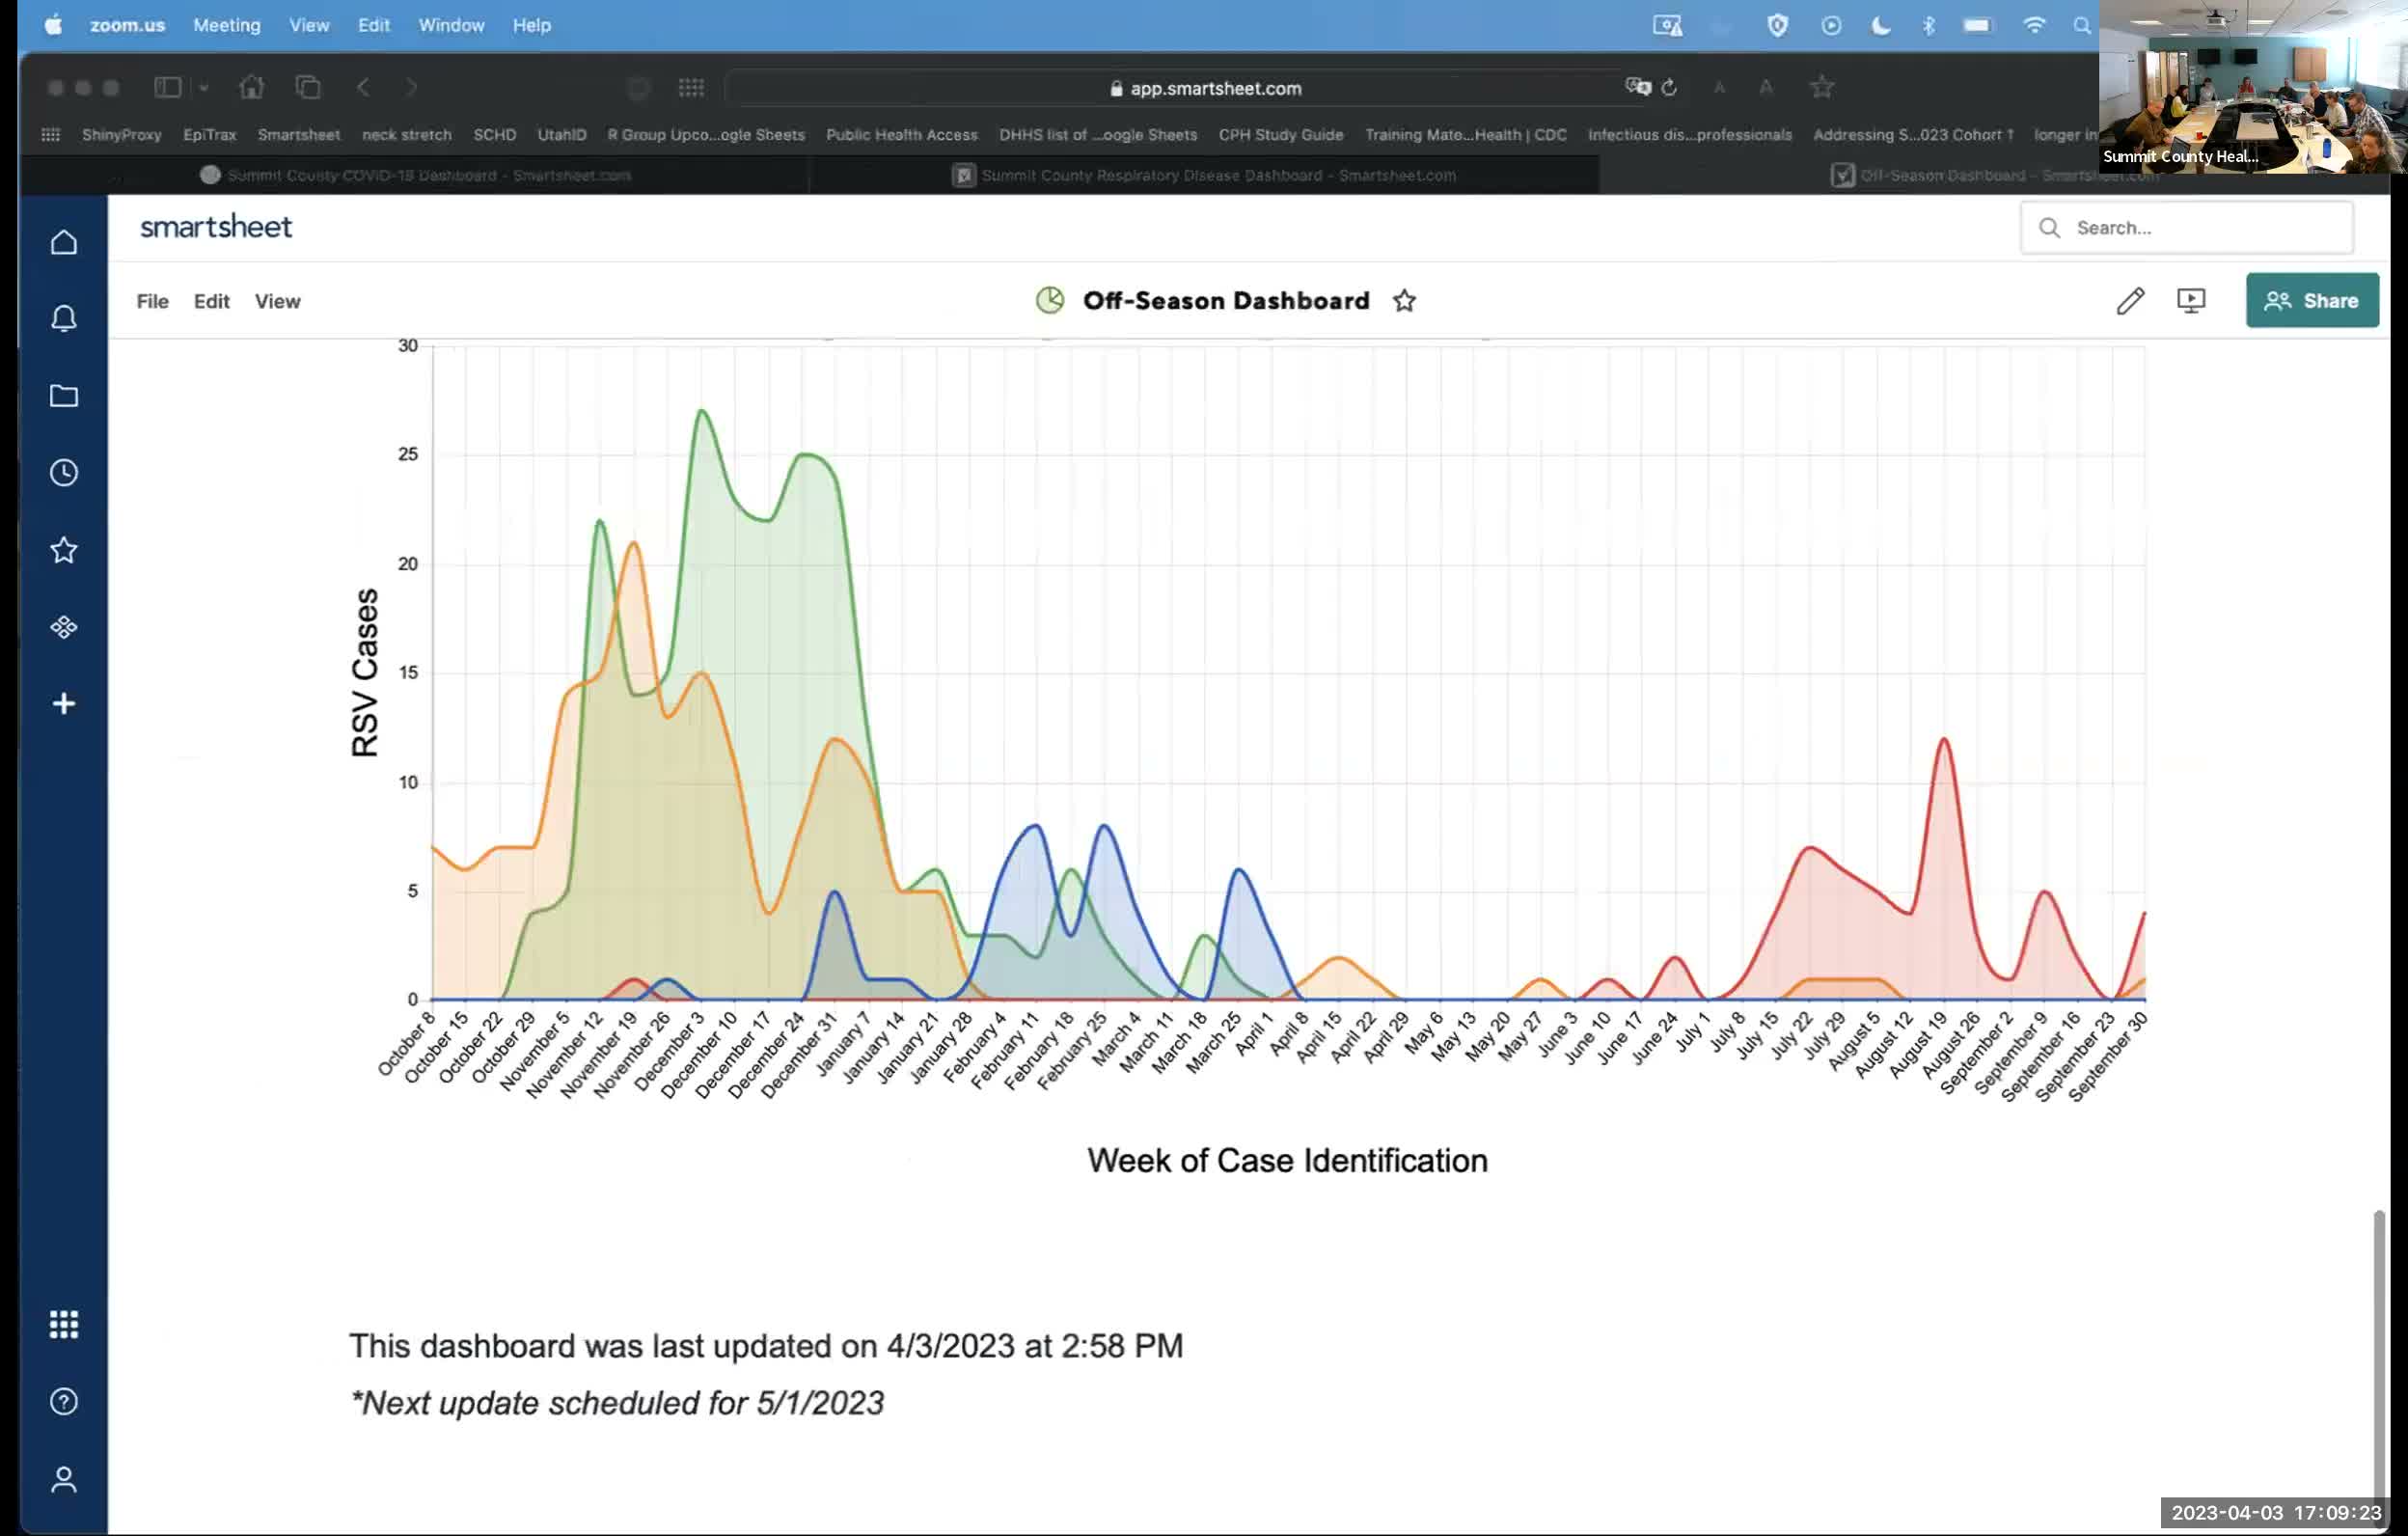
Nancy, the department's epidemiologist, presented a simplified off‑season disease dashboard that overlays seasonal years for COVID, influenza and RSV to make it easier to spot deviations from expected seasonality. She said the data come from state lab reporting and currently include only PCR, laboratory‑based tests, which affects measured COVID activity.
"Now that we are kind of at the end of flu RSV and hopefully COVID season," Nancy said, "I'm just showing COVID, influenza, and RSV ... this season in green has been very low." She described plans to monitor on a weekly basis and to update the dashboard monthly; if the county observes sustained increases (a few weeks), staff will add age‑group breakdowns and more frequent communications.
Board members asked about data sources, antigen reporting, and use of the dashboard for forecasting; Nancy said antigen tests are not reliably reported and the dashboard is designed as an early alert system tied to lab‑based metrics.
The board praised the epidemiologist's coding work and asked that forecasting and automated alerts be developed as follow‑up tasks.
"Now that we are kind of at the end of flu RSV and hopefully COVID season," Nancy said, "I'm just showing COVID, influenza, and RSV ... this season in green has been very low." She described plans to monitor on a weekly basis and to update the dashboard monthly; if the county observes sustained increases (a few weeks), staff will add age‑group breakdowns and more frequent communications.
Board members asked about data sources, antigen reporting, and use of the dashboard for forecasting; Nancy said antigen tests are not reliably reported and the dashboard is designed as an early alert system tied to lab‑based metrics.
The board praised the epidemiologist's coding work and asked that forecasting and automated alerts be developed as follow‑up tasks.
View the Full Meeting & All Its Details
This article offers just a summary. Unlock complete video, transcripts, and insights as a Founder Member.
✓
Watch full, unedited meeting videos
✓
Search every word spoken in unlimited transcripts
✓
AI summaries & real-time alerts (all government levels)
✓
Permanent access to expanding government content
30-day money-back guarantee
