Senate Education Committee hears equity briefing: many measures show parity but federal range ratio remains high
August 08, 2022 | EDUCATION COMMITTEE - SENATE, Senate, Committees, Legislative, Arkansas
This article was created by AI summarizing key points discussed. AI makes mistakes, so for full details and context, please refer to the video of the full meeting. Please report any errors so we can fix them. Report an error »
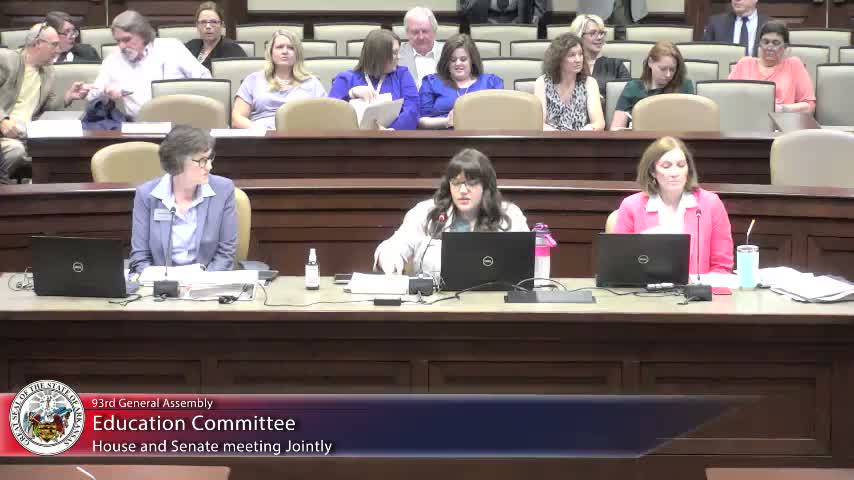
The Senate Education Committee received a briefing from Bureau staff on an equity and public‑school funding and expenditures report, which assessed horizontal, fiscal neutrality and vertical equity across Arkansas school districts.
Bureau presenters (Julie Hall, Adrienne Beck and Lori Bowen) said Arkansas shows evidence of parity by several measures. Under a narrow revenue definition (foundation funding plus property tax), they reported a 2021 mean of $8,145 per student and a median of $7,988; the federal range ratio for that revenue definition was reported at 0.42 and the coefficient of variation about 0.15. When categorical and supplemental funds were added, the presenters reported a 2021 mean of $9,142 per student, a median of $8,950 and a federal range ratio of about 0.50.
Julie Hall summarized index statistics used in prior court analyses and said the lower‑half index and Gini/Lorenz curves for Arkansas are “very close to 1” and “very close to 0” respectively in the presenters’ calculations, language the presenters used to say the lower half of districts looks fairly equal and overall inequality by Gini is low.
On fiscal neutrality, presenters said revenue per student remains correlated with property wealth but that the estimated wealth elasticity is low (presenters reported a slope on the order of 0.16–0.18, meaning roughly 16–18 cents of additional per‑student revenue for each additional dollar of property wealth), which staff characterized as a sign that Arkansas does not exhibit a strong wealth‑driven revenue divergence.
Lori Bowen’s vertical equity analysis arrayed districts by decile for average daily membership (ADM), percent non‑white, percent eligible for free/reduced lunch and property wealth; across both select state funding and all funds, smaller districts and those with higher shares of non‑white or high‑poverty students tended to show higher per‑student expenditures. The presenters also flagged that the federal range ratio — a statistic the courts have used as a rule of thumb — remains above the historical 0.25 threshold used in older decisions, and staff said this may reflect state categorical funding intended to address disparities and the infusion of federal pandemic funds.
Committee members requested follow‑up breakdowns: several asked for programmatic expenditure detail for the decile groups, analyses of URT (uniform rate of tax) districts’ spending patterns, and teacher salary comparisons by decile; presenters pointed to appendix tables (page 15 of the handout) and offered to provide additional cross‑tabulations.
The presenters concluded by offering to return with requested tables and to make the report and slides available in the committee record.
Bureau presenters (Julie Hall, Adrienne Beck and Lori Bowen) said Arkansas shows evidence of parity by several measures. Under a narrow revenue definition (foundation funding plus property tax), they reported a 2021 mean of $8,145 per student and a median of $7,988; the federal range ratio for that revenue definition was reported at 0.42 and the coefficient of variation about 0.15. When categorical and supplemental funds were added, the presenters reported a 2021 mean of $9,142 per student, a median of $8,950 and a federal range ratio of about 0.50.
Julie Hall summarized index statistics used in prior court analyses and said the lower‑half index and Gini/Lorenz curves for Arkansas are “very close to 1” and “very close to 0” respectively in the presenters’ calculations, language the presenters used to say the lower half of districts looks fairly equal and overall inequality by Gini is low.
On fiscal neutrality, presenters said revenue per student remains correlated with property wealth but that the estimated wealth elasticity is low (presenters reported a slope on the order of 0.16–0.18, meaning roughly 16–18 cents of additional per‑student revenue for each additional dollar of property wealth), which staff characterized as a sign that Arkansas does not exhibit a strong wealth‑driven revenue divergence.
Lori Bowen’s vertical equity analysis arrayed districts by decile for average daily membership (ADM), percent non‑white, percent eligible for free/reduced lunch and property wealth; across both select state funding and all funds, smaller districts and those with higher shares of non‑white or high‑poverty students tended to show higher per‑student expenditures. The presenters also flagged that the federal range ratio — a statistic the courts have used as a rule of thumb — remains above the historical 0.25 threshold used in older decisions, and staff said this may reflect state categorical funding intended to address disparities and the infusion of federal pandemic funds.
Committee members requested follow‑up breakdowns: several asked for programmatic expenditure detail for the decile groups, analyses of URT (uniform rate of tax) districts’ spending patterns, and teacher salary comparisons by decile; presenters pointed to appendix tables (page 15 of the handout) and offered to provide additional cross‑tabulations.
The presenters concluded by offering to return with requested tables and to make the report and slides available in the committee record.
View the Full Meeting & All Its Details
This article offers just a summary. Unlock complete video, transcripts, and insights as a Founder Member.
✓
Watch full, unedited meeting videos
✓
Search every word spoken in unlimited transcripts
✓
AI summaries & real-time alerts (all government levels)
✓
Permanent access to expanding government content
30-day money-back guarantee
